There are 3 contexts of laws required in trading . The appropriate LAWS OF THINKING for trading, the appropriate LAWS OF FEELINGS for trading , and the appropriate LAWS OF ACTIONS for trading.
The Successful trading is based according to these three laws on
1) POWER OF COLLECTIVE SCIENTIFIC THINKING: A GREAT AND SIMPLE SCIENTIFIC PERCEPTION OF THE FUNCTION OF THE ECONOMY THROUGH SOME GLOBAL STATISTICAL LAW. E.g. The law of Universal attraction in economy: that big money attracts more big money in the capital markets, and this by the balance of demand and supply makes securities indexes of the companies , that are indeed the big money, to have mainly stable ascending trend, whenever one can observe such one. Valid statistical deductions can be obtained with simple statistical hypotheses tests about the existence or not of a trend, with sample size half the period of a dominating cycle). (STABLE GREAT SCIENTIFIC THOUGHT-FORM OR BELIEF FACTOR IN TRADING. )
2) POWER OF COLLECTIVE PSYCHOLOGY: A LINK WITH THE POSITIVE COLLECTIVE PSYCHOLOGY.(E.g. that the growth of security indexes also represent the optimism of the growth and success of real business of the involved companies. And we bet or trade only on the ascension of the index, whenever an ascending trend is observable). (STABLE GREAT POSITIVE COLLECTIVE EMOTIONAL OR PSYCHOLOGICAL FACTOR IN TRADING. )
3) POWER OF INDIVIDUALS SIMPLE , CONSISTENT AND EASY TO CONDUCT PRACTICE. (e.g. a trading system with about 80% success rate that utilizes essentially only one indicator in 3 time frames, simple risk management rules of stop loss, take profit, trailing and escalation, and time spent not more than 20 minutes per day. In this way there are not many opportunities of human errors in the conduction of the trading practice. Failed trades are attributed to the randomness and are not to blame the trader). (STABLE SIMPLE AND EASY PRACTICAL FACTOR IN TRADING)
We may make the metaphor that successful trading is the ability to have successful resonance with the activities of top minority of those who determine the markets.
In trading there are 3 components in the feelings that must be dealt with. 1) The feeling of MONEY itself, 2) The feeling of the UTILITY of the money 3) The feeling of the RISK of the money each time. What is called usually money management in trading is essentially RISK MANAGEMENT.
VALID STATISTICS AND PREDICTABILITY
We must make here some remarks about the robust application of statistical predictions in the capital markets.
1) The theory that the efficient markets and in particular that they follow a pure random walk is easy to refute with better statistical experiments and hypotheses tests. The random walk would fit to a market where the sizes of the economic organizations are uniformly random. But the reality is that they follow a Pareto or power distribution, therefore this is inherited in the distribution of the volumes of transactions and also in the emerging trends or drifts.
2) The statistical models of time series are more robust , when they apply to the entity MARKET as a whole and are better as non-parametric , and not when they apply to single stocks and are linear or parametric. The reasons is that a time series as a stochastic process , requires data of a sample of paths, and for a single stock is available only a single path. While for all the market the path of each stock or security is considered one path from the sample of all paths of all the stocks. Linear time series models or derived like ARMA, ARIMA, SARIMA etc are destined to fail for particular patterns like those described in the post 32, because the true equations are non-linear and in addition with random, time varying coefficients that derive the random emergence of the 4 basic observable patterns (see post 32 ). In addition the standard application of the time series by the researchers, focuses on stationary time series after they extract a stable exponential trend, while in the reality the main concern should be the random path of the average value of the prices that shapes the patterns and is neither constant exponential trend neither zero ! The "statistical momentum conservation" might then be nothing else than an hypothesis that the random and time varying 1st order in time steps , partial correlation of the prices , is always positive. This can be easily tested statistically. E.g. in the cross exchange rate EURUSD but also in the indexes, the partial correlation of the current to the previous time step bar is measured indeed positive, in almost all time frames, except at the daily time frame, where the cyclic behavior prevails. In the daily time frame the partial correlation is negative , which means if one day is up the next day it is more probable that it is down. In addition, the cyclic behavior is even stronger in pairs of two days with negative partial correlation (two days up two days down etc). In searching for random cycles or periodicity, of say a single index or even instrument , the valid statistical practice requires the creation of a sample of paths over a time interval of a whole period, by collecting the pieces of the path at different periods as the market move as far as the searched periodicity is concerned may be considered as moving independently at independent periods.
3) The less ambitious the statistical application the more valid the result. E.g. applying a statistical hypothesis test, or analysis of variance to test if there is an up or a down trend (drift) or none, is a more valid statistical deduction , than applying a linear model of a time series and requiring prediction of the next step price.
4) Multivariate statistics, like factor analysis, discriminant analysis , logistic regression, cluster analysis , goal programming e.t.c., are possible to utilize for a more detailed theory of predictability and of portfolio analysis, and sector analysis of the market and not only H. Markowitz theory.
5) In applying of the above applications of statistics, the researcher must have at first a very good "feeling" of the data, and should verify rather with statistics the result rather than discover it.
6) The "Pareto rule of complexity-results" also holds here. In other words with less than 20% of the complexity of the calculations is derived more than 80% of the deduction. The rest of the 20% requires more than 80% more complexity in the calculations.
Probably the best instantaneous rewarding "why?", of manual trading is the joy and satisfaction in playing, among the situations of higher or lower uncertainty of what will happen in the global economy and markets, so as to plan and conduct a strategy that lets you know, on occasions, through data information and mathematical, and economic principles, what will happen with acceptable low uncertainty.
The most essential tool for successful and profitable above the average, trading from the three that the title of the book suggests (Law of growth, law of cycles, law of inequalities) is the law of cycles and the awareness to discover cycles in the charts of prices, that are not directly apparent. Especially when the cycles are 1) daily cycles to be traded with hourly or 4-hours bars and 2) Weekly cycles to be traded with hourly or 4-hours or daily bars 3) Monthly cycles to be traded with daily bars 4) Seasonal 3-months cycles to be traded with daily bars.
From the next cycles below (not including their harmonics, that is their sub-multiples of the periods) the order of intensity of effect on the price movements, and therefore the order of predictability also is approximately the next:
Daily (1 Day earth)>>
1 Year (12 months, earth)>>
11 years global climate (Sunspots) >>
Month (4 weeks, sun+moon)>>
2 weeks solar magnetic cycle (Parker Spiral)>>
160 mins Helioseismologic cycle >>
55 mins Helioseismologic cycle>>
5 mins Helioseismologic cycle.
These cycles are essentially 7 cycles: 2 cycles for the planet earth ,daily spin and annual rotation , and 5 cycles of the sun :11.1 years sunspot cycle, monthly 28 days spin of the sun. and 3 Helio-seismology cycles of 160 , 55, and 5 minutes
http://www.ckscientific.com/new_page_3.htm
In practice a trend indicator (positive feedback indicator) should be tuned to half the cycle's period, while an oscilator (negative feedback indicator) to the cycles full period.e.g. A moving average (which is usually utilised as a positive feedback trend indicator) on say M15 (15 minutes chart) if is intended to capture the 12 hours period sessional cycles , it should be used with n=24 (15minutes*24=360min=6 hours=12/2 hours) While for an oscilator trading (e.g. with a stochastic) again at M15 it should be used with K%period=48 ,Slow period=24 D%period=12. When the indicator has more than one parameter, or is say the cross of more moving averages, the optimal for stable signals, is to use the slowest equal to the full or half period n (according if it oscillator or trend indicator) and then for the other n/2, n/4, n/8 etc. The sequence of dividing by two (as in the timing...... in musical notation) has not only optimal properties but essentially it corresponds to tuning the indicator to only one number (the slowest or tonal ) while the other are sub-multiples (harmonics) of 2. Easier to remember easier to understandCycles are somehow related to emotions. There are people that recommend to exile emotions from the trading. Indeed at the begining if we rely only to our emotions, we result in to a bad trading. What works for us emotionally for other activities does not necessarily works in trading. But to discover really good trading, emotions will be needed. Not only some local backtests. We should require 50 years long validity. Rarely backtests can be carried out so back. Here is that laws are better than backtest (without having to abandon the feasible backtests). And furthermore for the good conduction of trading , the appropriate emotions are indispensable.
It is crucial to realize that such cycles may emerge in the price changes but statistically it is more valid and simpler to say that emerge at the quantity of average rate of return or change E(R) of the prices P , (E(R(n))=E(P(n)-P(n-1)/P(n-1)) , in a random way with a hazard rate of appearance at each period. Therefore periodicity is only intermittent and almost periodicity and not exact periodicity and refers to the rate of change of the prices (because it is assumed that in the long run there is a constant rate of change of the prices, as the Markowitz Portfolio Theory assumes).
The most predictable effect or pattern , after the long term permanent trend , modulated by such cycles is the reaction to an super-exponential moves (a blow-up at the end of trend in the form of super-exponential move or terminal spike). (See e.g. https://www.ted.com/talks/didier_sornette_how_we_can_predict_the_next_financial_crisis and http://www.er.ethz.ch/
Such super-exponential terminal patterns of trend may occur usually as result of overgrowth of the one of the two populations in a demand-supply coupling rather that of domination and not so much of competition or cooperation. See also post 22.
.The frequency of emergence and the size of such super-exponential blow-ups follows the law of inequalities in other words the Pareto or Lognormal distribution and is thus by fat more often than pure randomness would predict!)
THUS THE ORDER OF BETTER PREDICTABILITY IS
1) LONG TERM PERMANENT TREND
2) A CYCLE IN THE ORDER OF PREDICTABILITY DESCRIBED ABOVE AND REALIZED AS REACTION TO SUPER-EXPONENTIAL TERMINAL MOVE (OR SPIKE).
1) LONG TERM PERMANENT TREND
2) A CYCLE IN THE ORDER OF PREDICTABILITY DESCRIBED ABOVE AND REALIZED AS REACTION TO SUPER-EXPONENTIAL TERMINAL MOVE (OR SPIKE).
Here in the chart below which is with the prices after taking the logarithm, we may watch deviations from the linear moves (super-exponential moves) and their highly predictable reaction lasting in the average 3.75+1.75=5.5 years. during 30 years!

"The 12-color rainbow of celestial cycles "
| Color Terminology | Period | Observable in Ecological and other life phenomena | Observable Meteorological Magnitude | Astronomic Source |
| Deep Red | 11 years | Tree rings, Level of lakes , dendroclimatology , etc | Humidity, Solar radiation, Temperature, hazard rate of electromagnetic storms , tornados etc | Sun's magnetic poles cycle half period, sun's spot cycle period. Also observable in other stars (closests period in planets Jupiter's "year") |
| Magenta | 2.75 years | Fertility in trees | Humidity, Solar radiation, Temperature, hazard rate of electromagnetic storms etcStratospheric wind (QBO Quasi-Biennial-Oscillation cycles) | Sub multiple (1/4) of sunspots cycle. (closests period in planets Mar's "year") |
| Red | 1 year | 4 Seasons in the life of plants, and animal births | Humidity, Solar radiation, Temperature, pressure, Wind speed , hazard rate of tornados etc | Earth's year |
| Orange | 9 months | Women's pregnancy duration | Solar wind | (closests period in planets Venus' "year") |
| Light Orange | 6 months | 2 bold seasons (worm-cold division of year) | Humidity, Solar radiation, Temperature, pressure, Wind speed etc | Earth's year sub multiple (closest other planet period: submultiples of Mercury's "year") |
| Yellow | 1 month | Women's menstruation cycle, emotional cycles | Humidity, Solar radiation, Temperature, pressure, Wind speed , hazard rate of weather storms (tornados), hazard rate of earthquakes , solar wind etc | Average period of rotation (spin) of sun, rotation of moon, and orbital moon period |
| Green | 2 weeks | Up or down, slow motion of juices in trees | Weather , hazard rate of earthquakes (in moon and sun eclipses), solar wind. | Sub multiple of sun's spin period, and moon period. As the solar magnetism has 4-fold symmetry (Parker Spiral), the period of 1 week (28/4) becomes a natural division. |
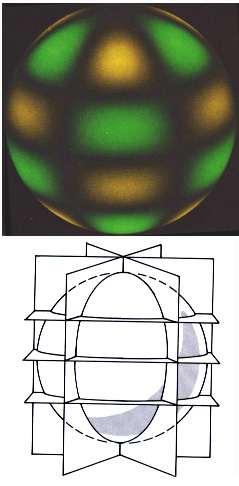
| Turquoise | 48 hours | The half period (2 days) is the average time that metabolism requires to absorb the proteins | Solar wind, earth's atmospheric wind speed An observable peak in the wind power spectrum | The 5-minutes helioseimological pulsation of the sun has 6-fold spherical harmonic symmetry.(See figure below) So dividing 26 which is the spin at the equator of the sun with 6 gives 4.3 days and the half period is 2.1 days Also (2 days) is the period of rotation of Venus clouds. |
| Blue | 24 hours | Day-night life functions of trees (O2, CO2 ) and animals, tides in the sea | Humidity, Solar radiation, Temperature, pressure, Wind speed Sea level etc | Earth's spin (day-night) period |
| Violet | 160 minutes (~ 2.7 hours) | Digestion cycle, In half period the average duration of cinema and video films (80-90 min) etc. | Wind speed, Solar windsemi-diurnal cycle | Low period of the solar ball pulsation (see Helioseismology) |
| Lila | 58 minutes (~ 1 hour) | Learning attention cycle. In half period as the duration of infomercials etc. Also according to studies, through breath, of advanced yogi the power of activities of the left and right side of the brain, alternate per hour. | Wind speed, Solar windAn observable peak in the wind power spectrum | Characteristic middle frequency of the solar ball pulsation (see Helioseismology) |
| Purple | 5 minutes | In half period as the duration of songs, TV advertisements, orgasm etc | Wind speed, Solar windAn observable peak in the wind power spectrum | Characteristic first observable frequency of the solar ball pulsation. Also observable in other stars (see Helioseismology) |
The five minute period of the sun creates spherical harmonics (l=6, m=3, n=?) as in the figure below
Yes there is periodicity! And no strict periodicity it is not the main observable in the prices! But there is literally (stochastic) periodicity in the volatility of the prices and the volumes. Using spectral analysis for the last 50 years on the volatility of the index SnP500, it has been found a clear strict periodicity of 11 years. It coincides with the Global Climate sunspot cycle. For a reference on a scientific publication here is the link
Yes there is periodicity! And no strict periodicity it is not the main observable in the prices! But there is literally (stochastic) periodicity in the volatility of the prices and the volumes. Using spectral analysis for the last 50 years on the volatility of the index SnP500, it has been found a clear strict periodicity of 11 years. It coincides with the Global Climate sunspot cycle. For a reference on a scientific publication here is the link
http://www.ckscientific.com/new_page_3.htm
Often periodicity in the prices appear for a time interval and then disappear. Happily the periods are quite fixed. I put two images of a table called the 12 rainbow celestial cycles with the most common such periods, that almost all of them have their origin in nature, or in Cosmic Economy as Buckminster Fuller would put it.
Although natural environment is strictly periodic as in the table above, and so also it may be with the volatility of the prices,the effect on the prices is not exact periodicity. The rule is: if a periodicity of nature, with period p, affects (modulates) economic prices, then what is observed in the prices, is a sequence of constant trends (drift) of duration equal to p/2, either up or down in a quite random way. What is invariant is the duration p/2 of the constant trend (drift) but they are not strictly alternating up and down as in a periodic phenomenon. We may have a run of 3 such up trends of duration p/2, then 2 down, then 1 up then 4 down etc. I call it Rainbow Walk of period p/2.
Of course the real final observable result is the superposition of all the effects of the 12 cycles, not of a single only cycle of them. But the previous mechanism was described when we isolate a single frequency.
According to my statistical analysis and trading systems backtests, the last 10 years, it seems that the dominating optimal frequency to trade is that of Blue, in other words the one or two days sessional periodicity. It is by far the most robust and consistent frequency with excellent trading results. It is somehow expected as the Day-Night periodicity is also the strongest from a physical point of view. I conceive it as the coupling of the planet spin with the sun's spin. This frequrency is somehow invisible in the charts of daily bars. It has to be discovered with appropriate statistical and backtest tools.
Simple statistics of the daily bars Open-High_Low_Close in Excel prove e.g. that in the period 2006-2011, the pairs of day that if the first day the market goes up (down correspondingly) , hen the second day the market goes down (up correspondingly), in other words the opposite direction are 54% of the cases while , the next day going in the same direction is only 46% of the cases. This "small" edge of 4% is an indication of the daily periodicity and may give the opportunity to design great systems! Although this property is not universal for all instruments, there is a universal system, at the daily periodicidy , that could be called planet-spin system. A. Dukas, had conducted a hybrid (half-manual) version of it during 2003, wih remarkable performance, with his own indicators, for all cfd's. .It is a waving-pattern trading system utilizing slow highpass and fast lowpass filters (see post 32).As the volumes of transactions are very strongly periodic from day to day ( see e.g. forex, due to the sessions), the rules of volumes are very significant for such intraday systems (see post 10 for the rules of volumes). The ForexGrowthBot spike-based system, (especially if focused only on terminal spikes) is a part of the Planet-spin system. Terminal spikes are more rare than initial spikes.
More than 80% of the money that I have ever lost in trading from 2003 to 2011 were lost in experimenting and trying to code a 100% automated system at the scale of 3 hours or 1 hour or less that would perform better than a corresponding 100% automated system at the scale of one or two days. The periodicities at the faster intra-day scales are quite more faint than the 1 or 2 days periodicity. So the present state of the art (2011) in econometry, trading system design and also in information systems and platforms, does not seem to permit the coding and run of an 100% automated trading system (without reinvestment of profits or money management and intraday optimal adjustments of position sizes and pyramiding, see posts 32,33 ) at the faster intra-day scales that would outperform a (half) manual set-and-forget daily system at the scale of 1 or 2 days. But even if the advance of science expertise and technology would one day produce such an automated system, then utilizing this very technology and shifting the application to the frequency of 1 or 2 days, would produce a half-automated set-n-forget system that most probably would perform again better.
The situation is different if reinvestment of profits and intraday optimal adjustments and pyramiding is utilized , (see posts 32,33) : Although periodicities faster than 1-2 days, e.g. 30 minutes or 180 minutes may be less clear and weaker , by applying fast intraday reinvestment of profits, optimal adjustments of position sizes and pyramiding ,( see posts 32,33) , thus an exponential growth on the lots sizes, it is possible to surpass in speed of capitalization of systems based on 24-48 hours periodicity where forecasting is easier. This speed can be increased by, concentrating in spike days and refraining from trading during calmer days. Still the combination of defining the almost constant trend at 24-48 hours, and 20 days background, and then making the optimal adjustments of positions sizes, and pyramiding at faster intraday periodicities, but over the constant trend over the 24-48 hours, seems to me to be the really optimal. Nevertheless, selecting strong spikes that last 1-10 days may lead to large intervals without trading, while for a few days during the spike, a very fast intraday tarding.The latter really gives God's speed in capitalization.
The second best frequency is that of the spin of the sun, in other words the monthly periodicity (Yellow rainbow frequency). The trades last about 10 trading days (2 weeks). Although it is the 2nd best frequency, it is some how easier with this (almost) periodicity, to design a universal system, in other words a system that applies with the same rules, to all instruments (stocks, commodities, forex etc). I have designed and tested such a system, which I call it Star-Spin.It is a waving-pattern trading system utilizing slow highpass and fast lowpass filters (see post 32). Example of 100% automated, though neural networks such system, is the TradeVantage system. Also the Bill Williams terminal spikes system at h4-timeframe, is essentially part of a spike-based Star-Spin system.Terminal spikes are more rare than initial spikes.
The hybrid conduction of the planet spin system, is more difficult than the hybrid conducation of the star-spin system, due to irregular hours that waves appear inside the day. It is better an 100% automated version of the planet spin system , which meets with more irregularity and noise though than a 100% automated version of the star-system.
An interesting question is if the above 12 rainbow frequencies have effects over the price movements that are mutually correlated or mutually independent. At a 1st simple simulation of the above 12 frequencies we may assume for the sake of simplicity mutual independence (As if a superposition of 12 independent stochastic processes). But my more than 10 year statistical analysis and backtests, show that neighbouring frequencies do have correlated effects in the prices. I have observed two types of correlations a) The rainbow walk at a particular frequency has upper and lower reflection barriers that their distance depends on the amplitude of the next lower frequency. I call them Rayleigh barriers and I discuss them at a special post (35). b) Trends (as runs of rainbow vectors) usually start and are correlated with spikes of the faster frequency (I discuss it also in a subsequent post (32) about spike-based trading systems).
These rainbow frequencies are key and characteristic frequencies of absolute, cosmic origin from 11 years to 5 minutes. These frequencies create corresponding periodicity in the volumes and the volatility of the prices of the markers. All indicators, and forecasting measurements on the prices must be tuned to these frequencies if we want to have optimally successful prediction. According to my statistical analysis and trading systems backtests, the last 10 years, it seems that the dominating optimal frequency to trade is that of Blue, in other words the one or two days sessional periodicity. It is by far the most robust and consistent frequency with excellent trading results. It is somehow expected as the Day-Night periodicity is also the strongest from a physical point of view. I conceive it as the coupling of the planet spin with the sun's spin. This frequrency is somehow invisible in the charts of daily bars. It has to be discovered with appropriate statistical and backtest tools.
Simple statistics of the daily bars Open-High_Low_Close in Excel prove e.g. that in the period 2006-2011, the pairs of day that if the first day the market goes up (down correspondingly) , hen the second day the market goes down (up correspondingly), in other words the opposite direction are 54% of the cases while , the next day going in the same direction is only 46% of the cases. This "small" edge of 4% is an indication of the daily periodicity and may give the opportunity to design great systems! Although this property is not universal for all instruments, there is a universal system, at the daily periodicidy , that could be called planet-spin system. A. Dukas, had conducted a hybrid (half-manual) version of it during 2003, wih remarkable performance, with his own indicators, for all cfd's. .It is a waving-pattern trading system utilizing slow highpass and fast lowpass filters (see post 32).As the volumes of transactions are very strongly periodic from day to day ( see e.g. forex, due to the sessions), the rules of volumes are very significant for such intraday systems (see post 10 for the rules of volumes). The ForexGrowthBot spike-based system, (especially if focused only on terminal spikes) is a part of the Planet-spin system. Terminal spikes are more rare than initial spikes.
More than 80% of the money that I have ever lost in trading from 2003 to 2011 were lost in experimenting and trying to code a 100% automated system at the scale of 3 hours or 1 hour or less that would perform better than a corresponding 100% automated system at the scale of one or two days. The periodicities at the faster intra-day scales are quite more faint than the 1 or 2 days periodicity. So the present state of the art (2011) in econometry, trading system design and also in information systems and platforms, does not seem to permit the coding and run of an 100% automated trading system (without reinvestment of profits or money management and intraday optimal adjustments of position sizes and pyramiding, see posts 32,33 ) at the faster intra-day scales that would outperform a (half) manual set-and-forget daily system at the scale of 1 or 2 days. But even if the advance of science expertise and technology would one day produce such an automated system, then utilizing this very technology and shifting the application to the frequency of 1 or 2 days, would produce a half-automated set-n-forget system that most probably would perform again better.
The situation is different if reinvestment of profits and intraday optimal adjustments and pyramiding is utilized , (see posts 32,33) : Although periodicities faster than 1-2 days, e.g. 30 minutes or 180 minutes may be less clear and weaker , by applying fast intraday reinvestment of profits, optimal adjustments of position sizes and pyramiding ,( see posts 32,33) , thus an exponential growth on the lots sizes, it is possible to surpass in speed of capitalization of systems based on 24-48 hours periodicity where forecasting is easier. This speed can be increased by, concentrating in spike days and refraining from trading during calmer days. Still the combination of defining the almost constant trend at 24-48 hours, and 20 days background, and then making the optimal adjustments of positions sizes, and pyramiding at faster intraday periodicities, but over the constant trend over the 24-48 hours, seems to me to be the really optimal. Nevertheless, selecting strong spikes that last 1-10 days may lead to large intervals without trading, while for a few days during the spike, a very fast intraday tarding.The latter really gives God's speed in capitalization.
The second best frequency is that of the spin of the sun, in other words the monthly periodicity (Yellow rainbow frequency). The trades last about 10 trading days (2 weeks). Although it is the 2nd best frequency, it is some how easier with this (almost) periodicity, to design a universal system, in other words a system that applies with the same rules, to all instruments (stocks, commodities, forex etc). I have designed and tested such a system, which I call it Star-Spin.It is a waving-pattern trading system utilizing slow highpass and fast lowpass filters (see post 32). Example of 100% automated, though neural networks such system, is the TradeVantage system. Also the Bill Williams terminal spikes system at h4-timeframe, is essentially part of a spike-based Star-Spin system.Terminal spikes are more rare than initial spikes.
The hybrid conduction of the planet spin system, is more difficult than the hybrid conducation of the star-spin system, due to irregular hours that waves appear inside the day. It is better an 100% automated version of the planet spin system , which meets with more irregularity and noise though than a 100% automated version of the star-system.
And the third best frequency is that related to the year (planets orbit around the sun, Red in the above rainbow table). I call it seasonal system. An example of a 100% automated universal system, based on seasonal periodicities on all commodities, stock indexes, currencies etc is that of Keith Fitshen, called Aberration which is running succesfully from 1980 till today (2012).(see e.g.
It is very important therefore to realize, that if we are seeking to maximize the performance of say a seasonal trading, we cannot do it by looking in frequencies faster that the daily period. (Even very fine scalpers of 3-5 pips per trade , are based on daily sessional periodicities, and a stationary ranging channel that has no small scale periodicity at all.). We should rather resort to two different factors:
a) Apply it to a multitude of stocks , thus increasing the time we are with open positions in the market
b) Utilize options (e.g.as Chuck Hughes is doing)
If we want nevertheless to trade at an intraday fast time frame, then the trading at the fast time frame, like e.g. m5 (5 minutes bars) , cannot be the same and should be entirely different from trading at a slow time frame, like e.g. d1. The reason is that at a fast intra-day time frame the periodicities are weak, the micro-trends unstable, and the noise of large amplitude. (see post 44 about neutral grid trading)
The phase of the 1st daily spin or periodicity is the obvious day-night hourly phase, as defined by the volumes of transactions. The annual spin or hidden periodicity is again the obvious seasonal again as defined by the volumes of transactions (especially in the agriculture commodities). And the monthly spin or hidden periodicity is strangely enough defined by the full moon and new moon. In the history of technical analysis it was formed a secrete "Delta society" when it was discovered how clearly statistically full moon and new moon was correlated with the tops and bottoms of the prices of gold (see e.g. http://www.gold-eagle.com/editorials_05/rosen112006.html)
Therefore by combining the a) Planet spin (day) b) Sun's spin (week or month) c) Planet orbit (year and its first, or second harmonic, e.g. quarter) we get the best and simplest combination of periodicities of the markets for consistent and more successful forecasting.It is very important therefore to realize, that if we are seeking to maximize the performance of say a seasonal trading, we cannot do it by looking in frequencies faster that the daily period. (Even very fine scalpers of 3-5 pips per trade , are based on daily sessional periodicities, and a stationary ranging channel that has no small scale periodicity at all.). We should rather resort to two different factors:
a) Apply it to a multitude of stocks , thus increasing the time we are with open positions in the market
b) Utilize options (e.g.as Chuck Hughes is doing)
If we want nevertheless to trade at an intraday fast time frame, then the trading at the fast time frame, like e.g. m5 (5 minutes bars) , cannot be the same and should be entirely different from trading at a slow time frame, like e.g. d1. The reason is that at a fast intra-day time frame the periodicities are weak, the micro-trends unstable, and the noise of large amplitude. (see post 44 about neutral grid trading)
The phase of the 1st daily spin or periodicity is the obvious day-night hourly phase, as defined by the volumes of transactions. The annual spin or hidden periodicity is again the obvious seasonal again as defined by the volumes of transactions (especially in the agriculture commodities). And the monthly spin or hidden periodicity is strangely enough defined by the full moon and new moon. In the history of technical analysis it was formed a secrete "Delta society" when it was discovered how clearly statistically full moon and new moon was correlated with the tops and bottoms of the prices of gold (see e.g. http://www.gold-eagle.com/editorials_05/rosen112006.html)
As the most direct effect of the underlying cycles is the cycles of volumes and volatility of the prices of the markets, the easiest method to exploit them is the volatility-short/volatility-long techniques. Although this terminology comes from the trading of options it is possible to create somehow artificial options with ordinary positions (even at forex). Examples of volatility-long techniques are the break-out methods, and examples of volatility-short techniques are the B. Williams angulation-counter-trend method or other counter-trend methods that focus on retracements of spikes. If to the 2 states volatility-increase (spikes or trending), volatility-decrease (detrending ) we add the state of intermittency or noise (ranging) we get the 3 elementary qualitative dynamics of the market in respect to its cycles.
Finanly I must remark that in Economics the most celebrated business cycles, are the Kitchin cycle of 5.5 years, the Kuznets (Nobel prize winner) cycle of 22.2 years ( a full solar sunspot cycle of 11.1+11.1 years) and the Kondradieff cycle of about 66 years. Schumpeter tried to combine all the tree of them, but at best their models are of deterministic dynamic systems (Chaos theory) while I believe that the right formulation is of random coefficient dynamic systems, that their cycles are actually the input influence on the economic phenomena not the output observable behavior.
A very interesting video by Mike Maloney, where among other things . we watch Kondradieff cycles of Gold and Stock prices is at
http://www.youtube.com/watch?v=tj2s6vzErqY
A nice book on business cycles is that by Lars Tvede Business Cycles , Routledge editions 2001.
See also this video about the 6-months cycles in various sectors
https://w3.absoluteprofits.com/Finance/ABS/LP/ABS-Secret-Calendar?dkt_nbr=v9fxenc1
For measuring with indicators and utilizing some of these cycles in forecasting , as they are modulating the non-marshalian demand-supply waving pattern see posts 20, 21, 32.
Probably the best instantaneous rewarding "why?", of manual trading is the joy and satisfaction in playing, among the situations of higher or lower uncertainty of what will happen in the global economy and markets, so as to plan and conduct a strategy that lets you know, on occasions, through data information and mathematical, and economic principles, what will happen with acceptable low uncertainty.
(And from a macroscopic point of view, probably the stronger reason for studying scientifically the capital and money markets, is that among all civilizations in the galaxy, this earthly civilization, is the only one with extremely complicated , massive alienating and evil economics. The more advanced civilizations do not even use money inside them, but only for simple commerce with different civilizations. For a mind therefore perceiving all reality, it is challenging to go through the underlying mathematical and scientific laws of such a rare economic phenomenon.)
No comments:
New comments are not allowed.